
The CO2 content is a reliable indicator of air quality in offices, classrooms or living rooms.
In fresh air, the concentration of carbon dioxide is around 400 ppm. This means “parts per million”, in this case 400 molecules of CO2 per million molecules of air. Even though it’s only 0.04 percent, it has a noticeable effect.
Inside, the concentration increases rapidly due to human respiration (i.e. breathing). Surprisingly, when showing a film in a cinema, CO2 levels of several thousand ppm can be quickly reached. If CO2 levels are high enough, it can lead to poor concentration, fatigue and headaches.
A CO2 measuring station can tell you when it’s a good time to open the windows: fresh air is needed if CO2 levels reach 1,500 ppm or higher.
What you will need
First, you need a Raspberry Pi with a reasonably up-to-date Raspberry Pi operating system. It doesn’t matter which Raspberry model you use.
You also need a CO2 sensor. The MH-Z19C sensor from the Chinese manufacturer Winsen Electronics Technology is used in this article. The MH-Z19B model works the same way.
When purchasing, you should choose a model with pins, otherwise you will have to solder it yourself. Pins or headers are small pins that you use to connect the sensor to the Raspberry Pi. The version with headers is available on Amazon, so be sure to choose this version when you purchase it.
Finally, you will also need jumper cables. You will need the female/female variant for the sensor.
In total, the investment is less than $40, while professional CO2 measuring devices cost much more if you buy ready-made models.
Important: To read the sensor, the Raspberry Pi communicates via the serial interface, disabled by default. To change this, use the tool
raspi-configand select “Serial Port” under “Interface Options”.
How the sensor works
The MH-Z19C (or B) is a non-dispersive infrared (NDIR) sensor. These are based on the absorption of electromagnetic radiation in the infrared wavelength range as a function of concentration. Carbon dioxide absorbs infrared radiation in a specific and measurable way.
The light source transmits IR radiation through the air which must be measured by the sensor itself. A filter is attached to the front which allows the absorption wavelength of the target gas to pass.
If the concentration increases, the absorption increases according to the Lambert-Beer law and the signal decreases accordingly. The sensor determines the resulting light intensity and converts it to ppm.
How to connect the sensor to the Raspberry Pi. The sensor should be seen from below.
Foundry
Setting up the circuit
To set up the circuit, first turn off the Raspberry Pi and unplug it from the power supply. Then connect the circuit board to the sensor. You will need four female/female jumper cables, that is, with plugs on both ends.
You can see the function of each connection on the underside of the sensor. Connect pin 6 of the sensor (labeled “VCC” or “Vin”) to pin 4 of the Raspberry Pi. This is the five volt power supply. Pin 4 is second from the top on the right side of the GPIO strip.
Now connect the “GND” pin (7) of the sensor to pin 6 of the Raspberry board. This is the ground wire. It is located directly under pin 4.
Halfway through, continue to the other side of the sensor which has five connections: The “Rx” pin (2) of the sensor must be connected to pin 8 of the mini calculator, directly under pin 6.
Finally, connect the “Tx” pin (3) of the sensor to pin 10 of the Raspberry Pi, directly below pin 8. The illustration above shows the complete setup again. Finally, start the Raspberry Pi by reconnecting it to power.
Read measured values
The CO2 sensor is ready for use. A Python script is required to read the current CO2 value. Fortunately, one of them was developed by a Japanese developer – just for your information, to explain the Github address. You install the script with other components by opening a terminal on the Raspberry Pi and entering the following command:
git clone https://github.com/UedaTakeyuki/mh-z19.gitThen navigate to the newly created folder “~/mh-z19” and run the installation script:
./setup.shTo determine the current CO2 value, use this command in the future:
sudo python -m mh_z19You will receive a result such as “{“co2″: 3128}”. The unit is the current ppm of CO2.
The measured values can be automatically displayed online and clearly show the effect of ventilation.
Foundry
Values measured online
Always reading the measured values manually on the Raspberry Pi is annoying and too tedious in the long run. It is therefore preferable to display the measured values online over time.
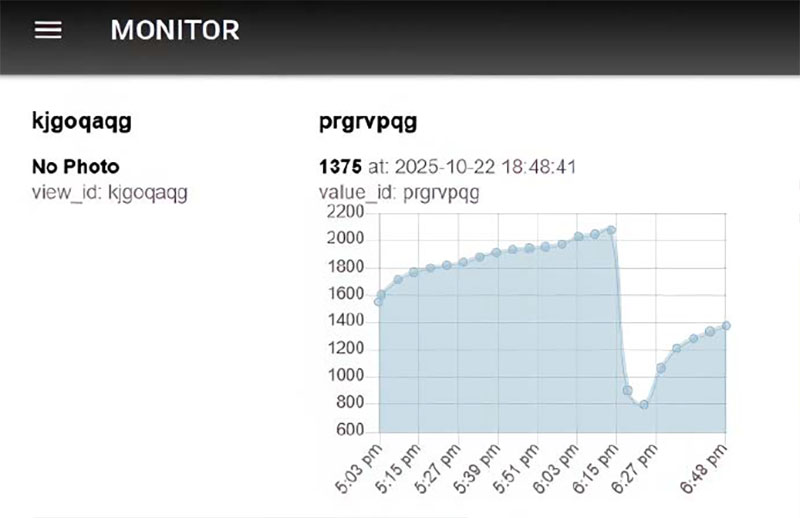
Use a free online service to access the history of measured values via PC or smartphone. Go to monitor3.uedasoft.com and enter an email address and password to log in. You will receive a “view_id”, which you do not need.
Click on the menu item Elements. Note the second letter combination in the list, in the example “prgrvpqg”, and set the corresponding option to Active. Click on To safeguard to finalize the configuration.
Now open a terminal on the Raspberry Pi and navigate back to the “mh-z19” folder. There you call the command
./setid.sh [abcdefgh]replacing the sequence of letters with the eight-digit letter combination you just wrote down. This call allows you to check if everything is working correctly:
sudo python -m pondsliderIf the word “true” appears in the bottom line of the output, then everything is fine. In order to now regularly receive measured values and enter them into the Monitor application, enter the command
./autostart.sh --onIn the browser you can now see how the chart on the Monitor page increases by a measured value every five minutes. The number of measured values displayed can be set directly below using the “Settings” button.
To cover ten hours you need 120 values. Thanks to the diagram, you can see at a glance if anyone ventilated the room while you were eating lunch or doing your shopping.
The graph with the measured values can also be easily viewed with a smartphone and downloaded as a CSV file via the “Download” button for analysis in Excel. After restarting the Raspberry Pi, the measurement script restarts automatically.
The concept can be further expanded. With a red LED, a suitable resistor of 330 Ohm and a slightly modified Python script, it is possible to create a circuit in which the LED lights up as soon as the measured value exceeds a specified CO2 limit value.


: Mohu, Clearstream, one for all")
